(Art direction and design: Jean-Dominique Lavoix-Carli)
The world is poised to make the effort to treble its nuclear energy capacity by 2050. Even though uranium reserves are meant to be abundant and widespread worldwide, the necessity of producing uranium from mines, with long timelines from exploration to extraction and milling, added to the fate of geography and to a volatile national, international and geopolitical context, let us expect that politics and geopolitics could soon become very important factors for uranium supply, thus to see demand met, and, as a result, for nuclear energy production (see Helene Lavoix, “Uranium and the Renewal of Nuclear Energy“, The Red Team Analysis Society, 9 April 2024).
- The Future of Uranium Demand – China’s Surge
- Uranium and the Renewal of Nuclear Energy
- AI at War (1) – Ukraine

- Anticipate and Get Ready for the Future – Podcast

- The Return of Nuclear Energy
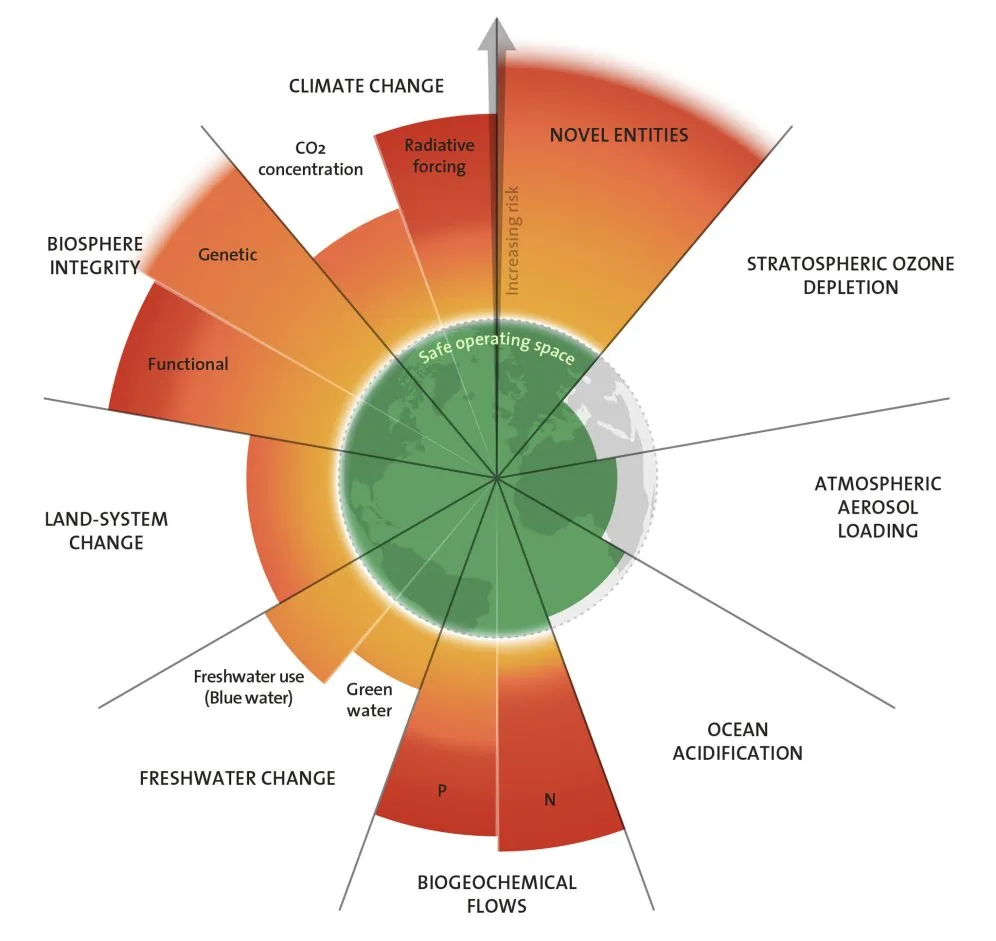
- Climate Change, Planetary Boundaries and Geopolitical Stakes

- Apocalypse in the Red Sea – Anthropocene Wars (9)

To be able to assess further what could happen in the future, we need to go beyond, or rather beneath, the global level.
In this article, we look at uranium demand at country level, which is greatly determined by operating and planned nuclear plants. Thus, first we establish a base case scenario for the future of nuclear energy capacities, upon which the 2023 decision to treble nuclear energy and related policies will apply. We follow the evolution per country and notably China’s surge, which displaces America’s lead. We then highlight a direct geopolitical consequence of the multiplication of nuclear reactors on territories, as nuclear plants become essential elements in the theatres of war. Finally, we turn to the need for uranium per country.
Present and future nuclear energy capacity across the world
The demand for uranium obviously depends first on the nuclear energy produced by a country, which, in turn, depends on the operating nuclear reactors (Nuclear Energy Agency (NEA)/International Atomic Energy Agency (IAEA), Uranium 2022: Resources, Production and Demand (Red Book), OECD Publishing, Paris, 2023).
- The Future of Uranium Demand – China’s Surge
- Uranium and the Renewal of Nuclear Energy
- The Return of Nuclear Energy
- Early Warning for Individuals and Small Businesses – Overcoming Energy Insecurity

If the world intends trebling the capacity to generate nuclear energy then we need to find out, per country, how many nuclear plants exist, how many are already planned and how many more need to be added. The existing and planned nuclear capacity on the one hand, the capabilities that need to be added to meet the trebling objective, on the other, will then determinate scenarios for the coming demand for uranium at country level.
However, as most decisions regarding nuclear capacities, thus related plans, were taken before the December 2023 decision for the renewal of nuclear energy, existing programs and projects will likely change. To consider this possibility, what we assess here, in terms of nuclear capacities, is a base case scenario.
From the American lead to the Chinese supremacy?
Nuclear energy production in 2024
In April 2024, the global nuclear energy production reached 375,57 GWe net (IAEA – PRIS, 14/04/2024). Compared with the assessment made by the NEA/IAEA for the start of 2021 with a net energy generating capacity of 393 GWe, we would thus have a decrease of 4,43% (Uranium 2022, p. 12). Considering the IAEA – PRIS, 14/04/2024 statistics, we would have an increase of 1,23% compared with 2022 from 370,99 GWe and of 2,39% compared with 2021 (year-end) from 366,79 GWe.
The nuclear energy generating capacity per country is shown on the chart below:
Source: IAEA PRIS 14/04/2024
Source: IAEA PRIS 14/04/2024
The largest producers of nuclear energy are, by order of importance, the United States, followed by France, China, Russia, the Republic of Korea, Canada and Ukraine, as shown on the pie chart. All together they represent 80% of the world production.
From present to future nuclear energy capacities
Considering the time needed to build a nuclear plant, as well as the stringent regulations surrounding the nuclear industry, we have a pretty good idea of tomorrow’s nuclear generating capacity landscape for classical plants, i.e. excluding small modular reactors (SMR) and advanced modular reactors (AMR).
On top of current operating plants, we need to look at reactors in construction (known until 2030), then at those planned (up to 15 years in the future), and finally to those proposed (not yet planned, with an uncertain timeline) (World Nuclear Association, “Plans For New Reactors Worldwide“, April 2024).
Nonetheless, we should add to the base case scenario a variation according to the number of reactors that could be shutdown, or on the contrary, that could be subjected to extended operations. In 2023, the World Nuclear Association (WNA) estimated that “Upwards of 140 reactors could be subject to extended operation in the period to 2040” (Global Scenarios for Demand and Supply Availability 2023-2040, 21st edition, Sept 2023). Otherwise, it appraised in its 2023 reference scenario that 66 reactors would close by 2040 (WNA, Notes in “World Nuclear Power Reactors & Uranium Requirements“, April 2024).
By 2030 China overtakes France in nuclear energy production
If we add to the current capacity the reactors in construction we obtain the nuclear capacity for the year 2030
For the base case scenario, if we look at the reactors under construction, as shown on the chart below, we obtain an idea of the maximum (i.e. assuming there is no reactor shutdown) nuclear capacity countries should reach by 2030 (WNA, “Plans For New Reactors Worldwide“, April 2024, and IAEA PRIS 14/04/2024 “Under Construction”).
Source: IAEA PRIS 14/04/2024 and WNA
In 2030, in share of the world production, if the United States still lead, China overtakes France. Then follow Russia, the Republic of Korea, Ukraine, Japan, Canada and India, which enters the group of the largest nuclear energy producers. All together, these nine countries represent 80 % of the world nuclear energy production.
By 2039 China leads the world in nuclear energy production
We can then add the “classical” nuclear plants that are planned, i.e. according to the WNA’s taxonomy, those plants for which “approvals, funding or commitment [is] in place, mostly expected to be in operation within the next 15 years” (WNA, “Plans For New Reactors Worldwide“, April 2024).
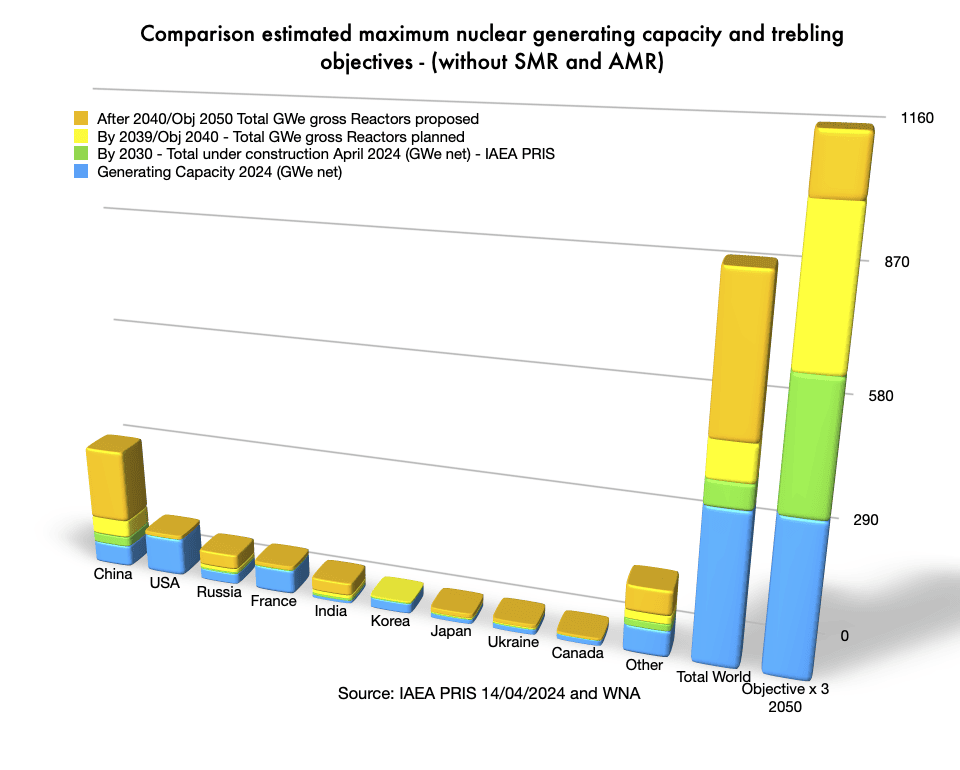
Thus by 2039, we can estimate to have a maximum nuclear generating capacity per country (without SMR and AMR) as shown on the chart below.
Source: IAEA PRIS 14/04/2024 and WNA
In 2039, in share of the world production, China now leads the world followed by the United States, France, Russia, the Republic of Korea, India, Ukraine, Japan, and Canada. All together, these nine countries represent 81 % of the world nuclear energy production.
From 2040 onwards China’s nuclear energy production dwarves other countries
Finally, we can add to the nuclear energy capacity the proposed nuclear plants, which correspond, according to the WNA to “Specific programme or site proposals” but for which the timing is very uncertain (Ibid.). We can assume they will start operating in more than 15 years, thus earliest in 2040.
We see here efforts made by most country, led especially by China, with 186,4 GWe proposed, followed in a lesser way by Russia with 37,7 GWe, and India with 32 GWe, as seen in the chart below. The nuclear capacity China proposes to build represents half of the 2024 nuclear capacity for the whole world.
If no further efforts at planning for new reactors and at proposing programmes are made, within a quarter of a century, the United States will have completely lost its dominating place and will be far behind China. France, similarly seems to be plagued by an inability to plan and propose ahead, falling from the second to the fourth place in terms of nuclear energy capacity, and from representing 16% of the world nuclear energy capacity to 8%.
Source: IAEA PRIS 14/04/2024 and WNA
After 2040, always looking at maximum capacity for the base case scenario, and without taking into consideration SMRs and AMRs, in share of the world production, China now leads by far followed by the United States, Russia, France, India, the Republic of Korea, Japan and Ukraine. Canada is not part anymore of the main nuclear energy producers. All together, these eight countries represent 80 % of the world nuclear energy production.
Yet, more must be done

Nonetheless, if we do not take into account SMRs and AMRs, despite China’s sustained efforts to develop its nuclear energy generating capacity, which implies the Middle Kingdom potentially represents one quarter of the world after 2040, so far, globally, we are short of the objectives set to treble nuclear capacity.
We pay the absence of long term planning we saw in the previous article and the consequent deficiency in terms of reactors under construction.
Apart for China, this lack of anticipation has not yet been corrected and is still operating at the stage of planification of reactors. We may assume that the new pro-nuclear global policies will amend this approach. However, considering the long timeline necessary between the decision to build nuclear generators and their commercial connection to the grid – approximately 15 years – firm and committed decisions will have to be taken by the end of 2024, latest 2025, if we want to see the objectives to treble world capacity by 2050 met.
A widespread use of SMRs and AMRs could help close the gap. It could also help papering over difficulties at anticipation, rather than addressing the problem. However, the SMR and AMR approaches are still novel, with more than 80 different designs for SMRs and we have little real life experience for their use, advantages and drawbacks (IAEA, Joanne Liou, “What are Small Modular Reactors (SMRs)?“, 13 September 2023; Charles Cuvelliez, “Nucléaire : pourquoi tant d’attirance pour les SMR ?“, La Tribune, 28 May 2023) . Detailed scenarios must be done before their deployment. Obviously, human beings cannot escape the imperatives of anticipation and planning, especially in terms of governance and in the nuclear field.
What about security and warfare?
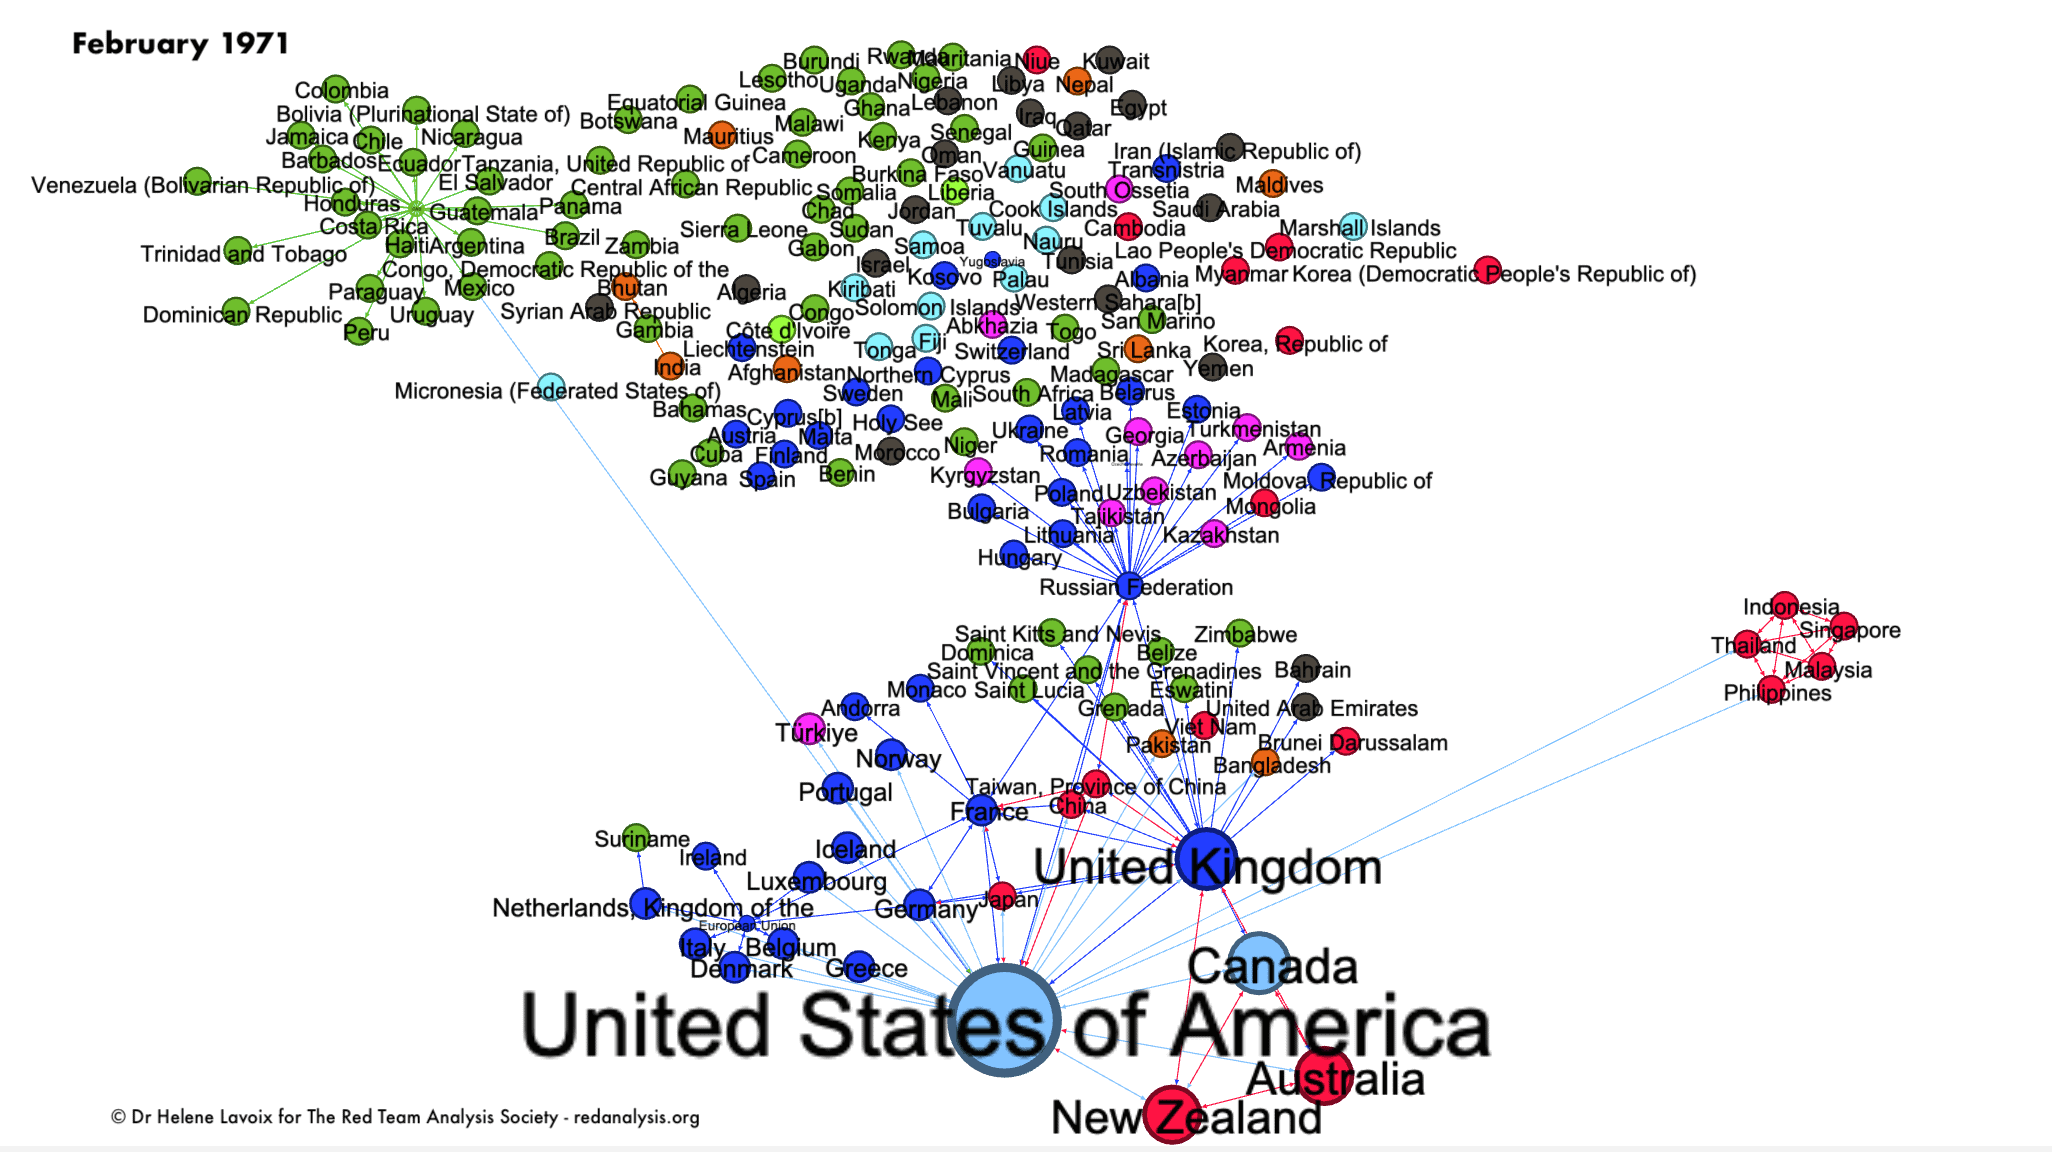
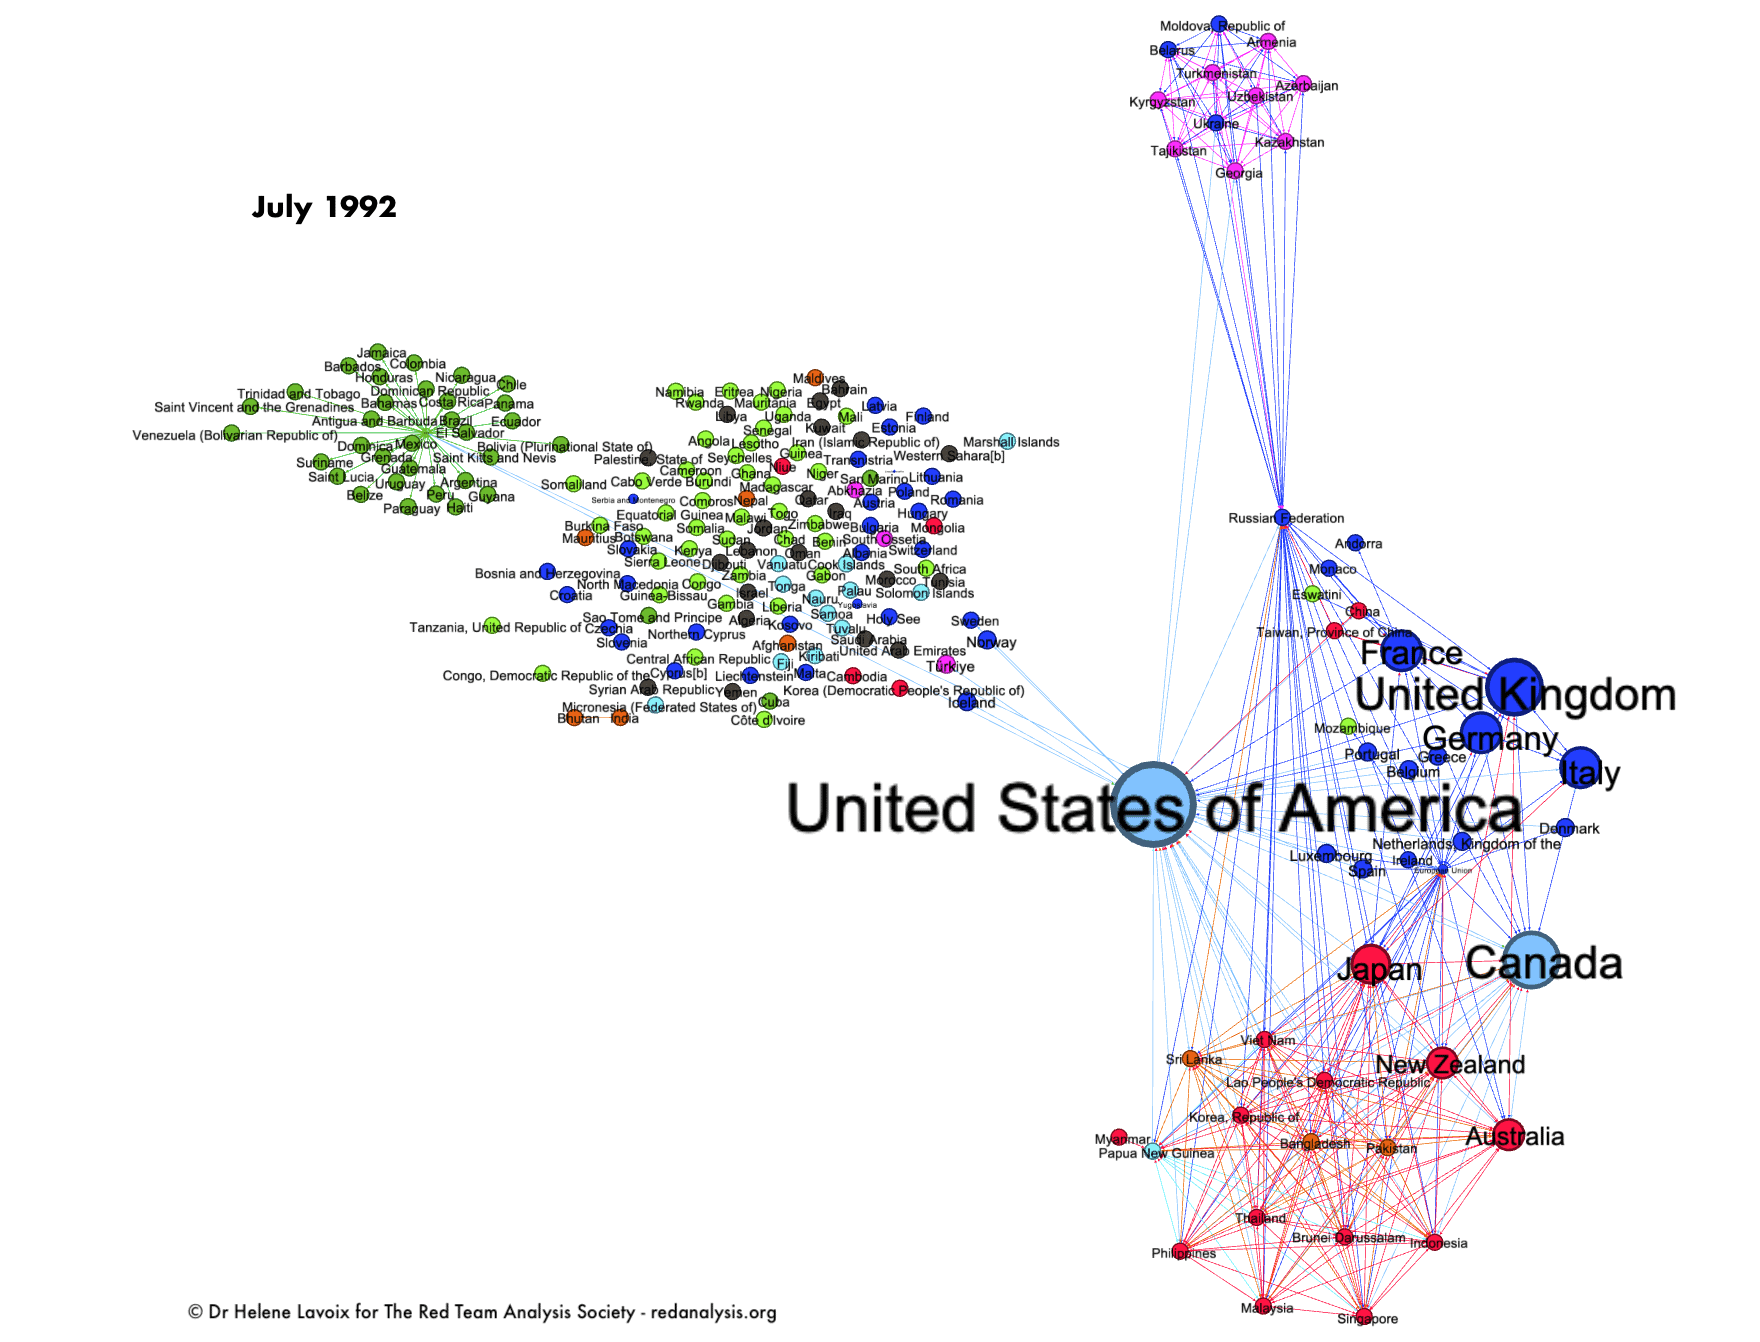
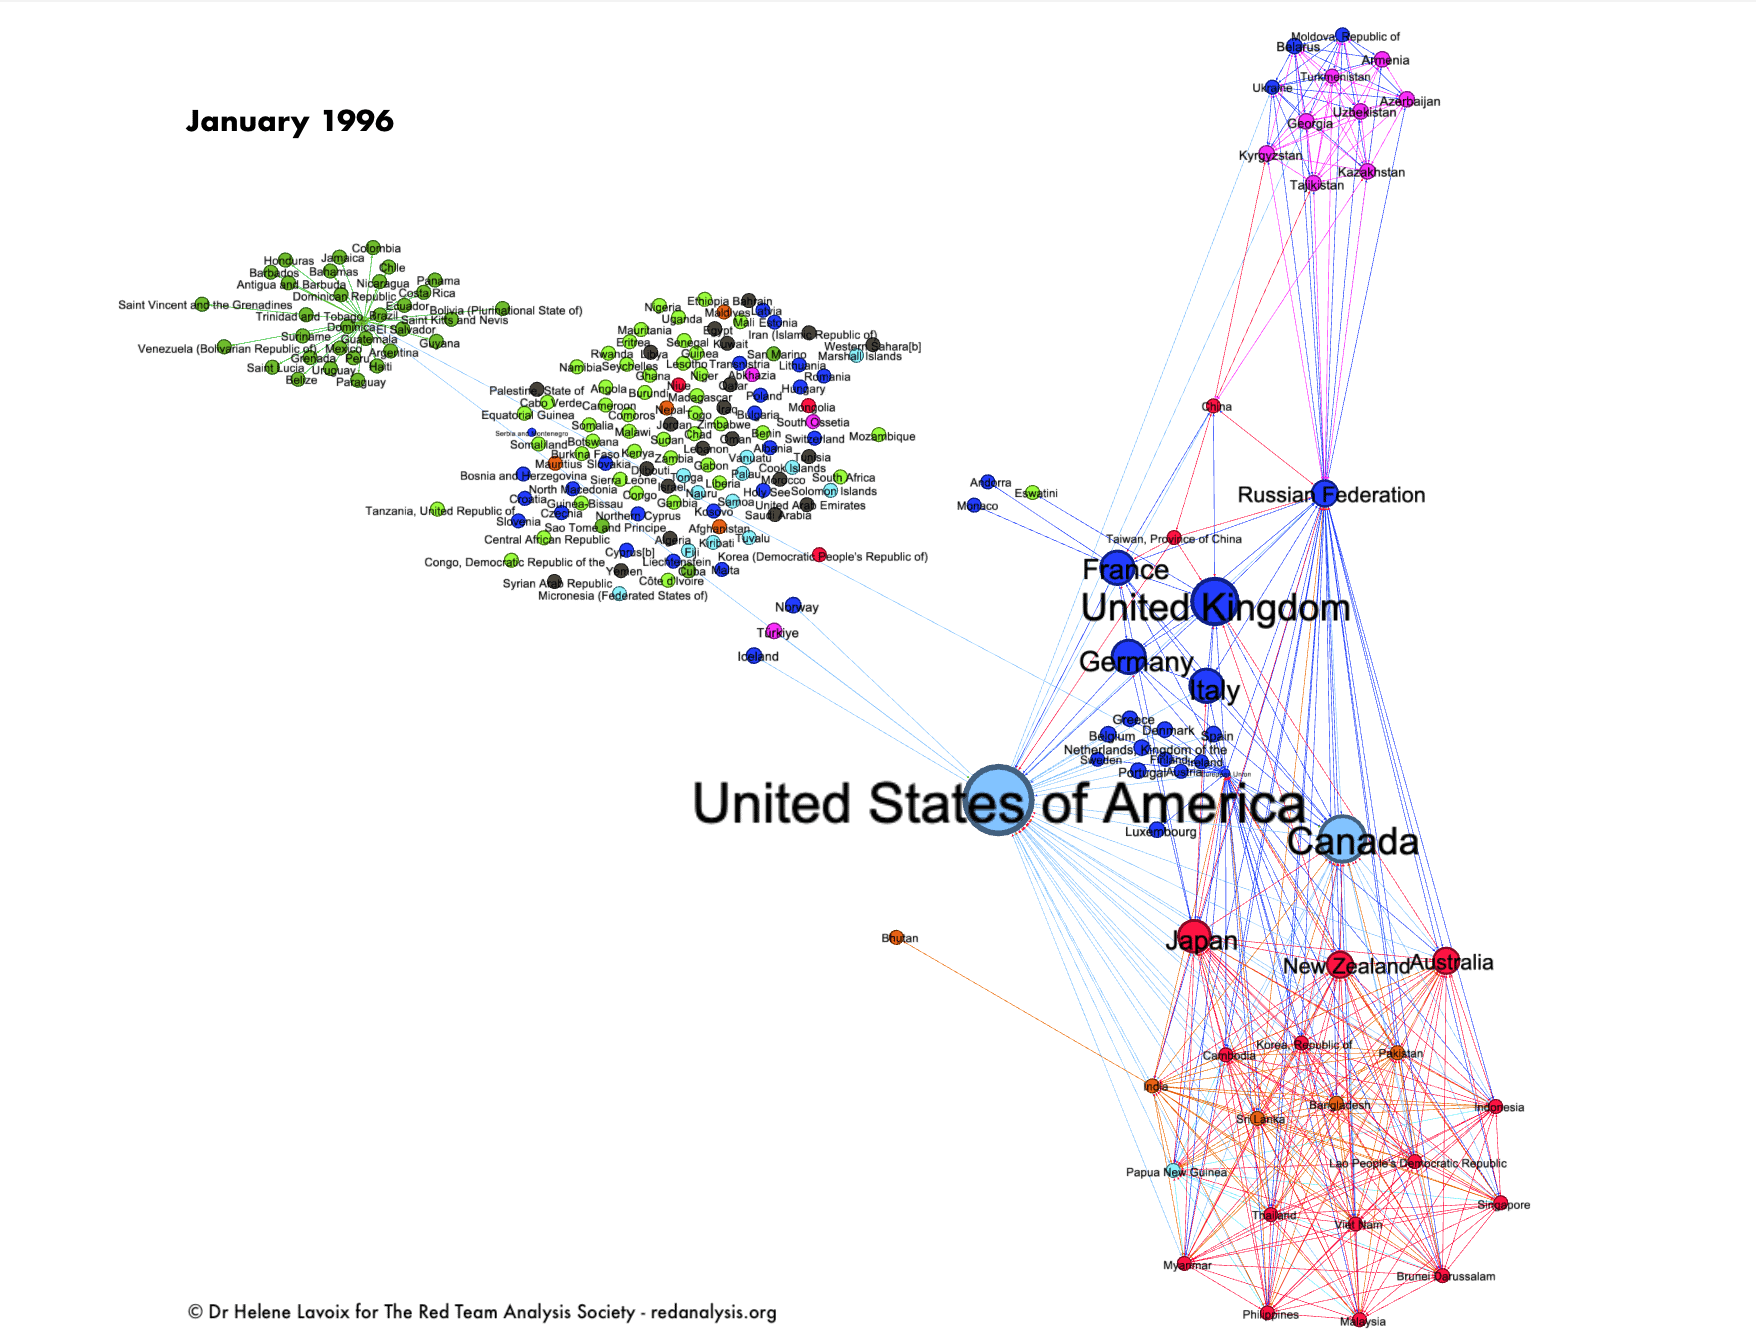
A direct geopolitical consequence of the trebling of nuclear capacities lies in the multiplication of nuclear generators on a territory. What will that imply in terms of future war strategy and tactics?
When one sees the multiple drama surrounding Ukraine’s Zaporizhzhia Nuclear Power Plant since the start of the war (e.g. among many “Is Ukraine’s Zaporizhzhia nuclear plant at risk of an ‘accident’?“, Al Jazeera, 16 Apr 2024), one may easily imagine the dangers entailed by an attack on a country with many nuclear reactors (e.g. Joanna Przybylak, “Nuclear power plants in war zones: Lessons learned from the war in Ukraine“, Security and Defense Quarterly, 2023. doi:10.35467/sdq/174810; Marc Léger, “Le nucléaire, la guerre et le droit de la guerre, SFEN, 25 July 2023; Assemblée Nationale, “Rapport de la commission d’enquête sur la sûreté et la sécurité des installations nucléaires“, 2018 ).
Indeed, any civilian nuclear installation may become weaponised by belligerants, from hindering energy supply to blackmailing opponents (Przybylak, “Nuclear power plants in war zones…), through forbidding carpet-bombing, or counter-attacking and sacrificing population in exchange for casualties inflicted to an occupation force, etc.
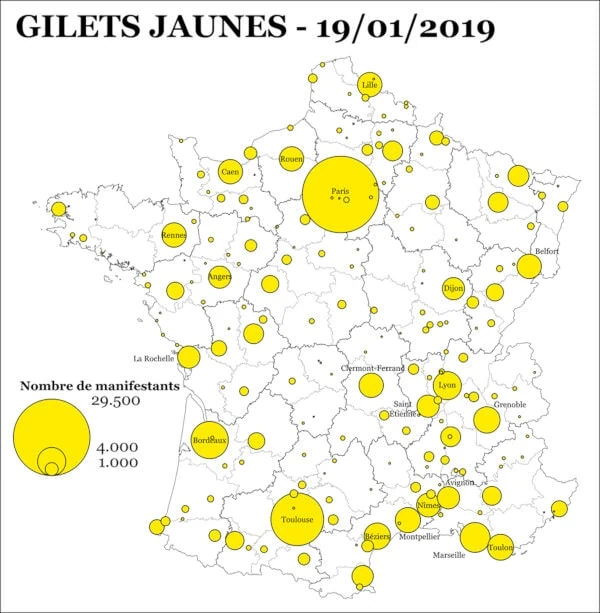
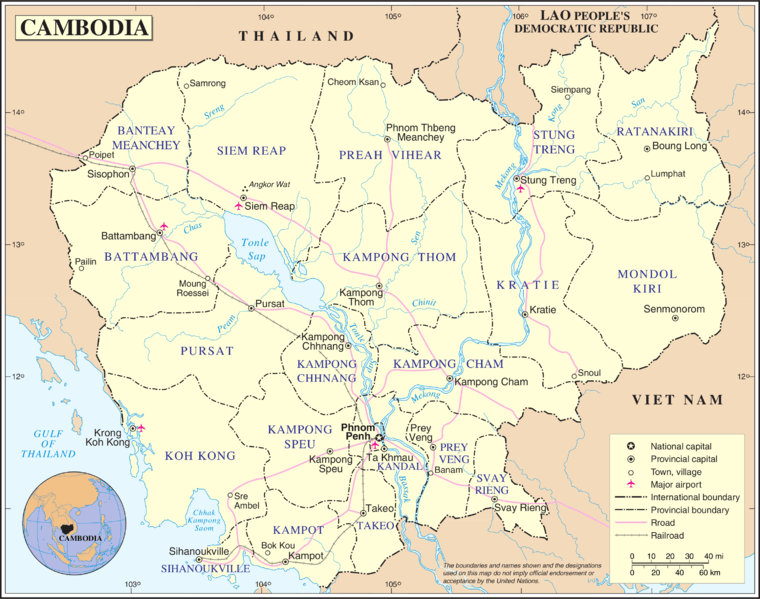
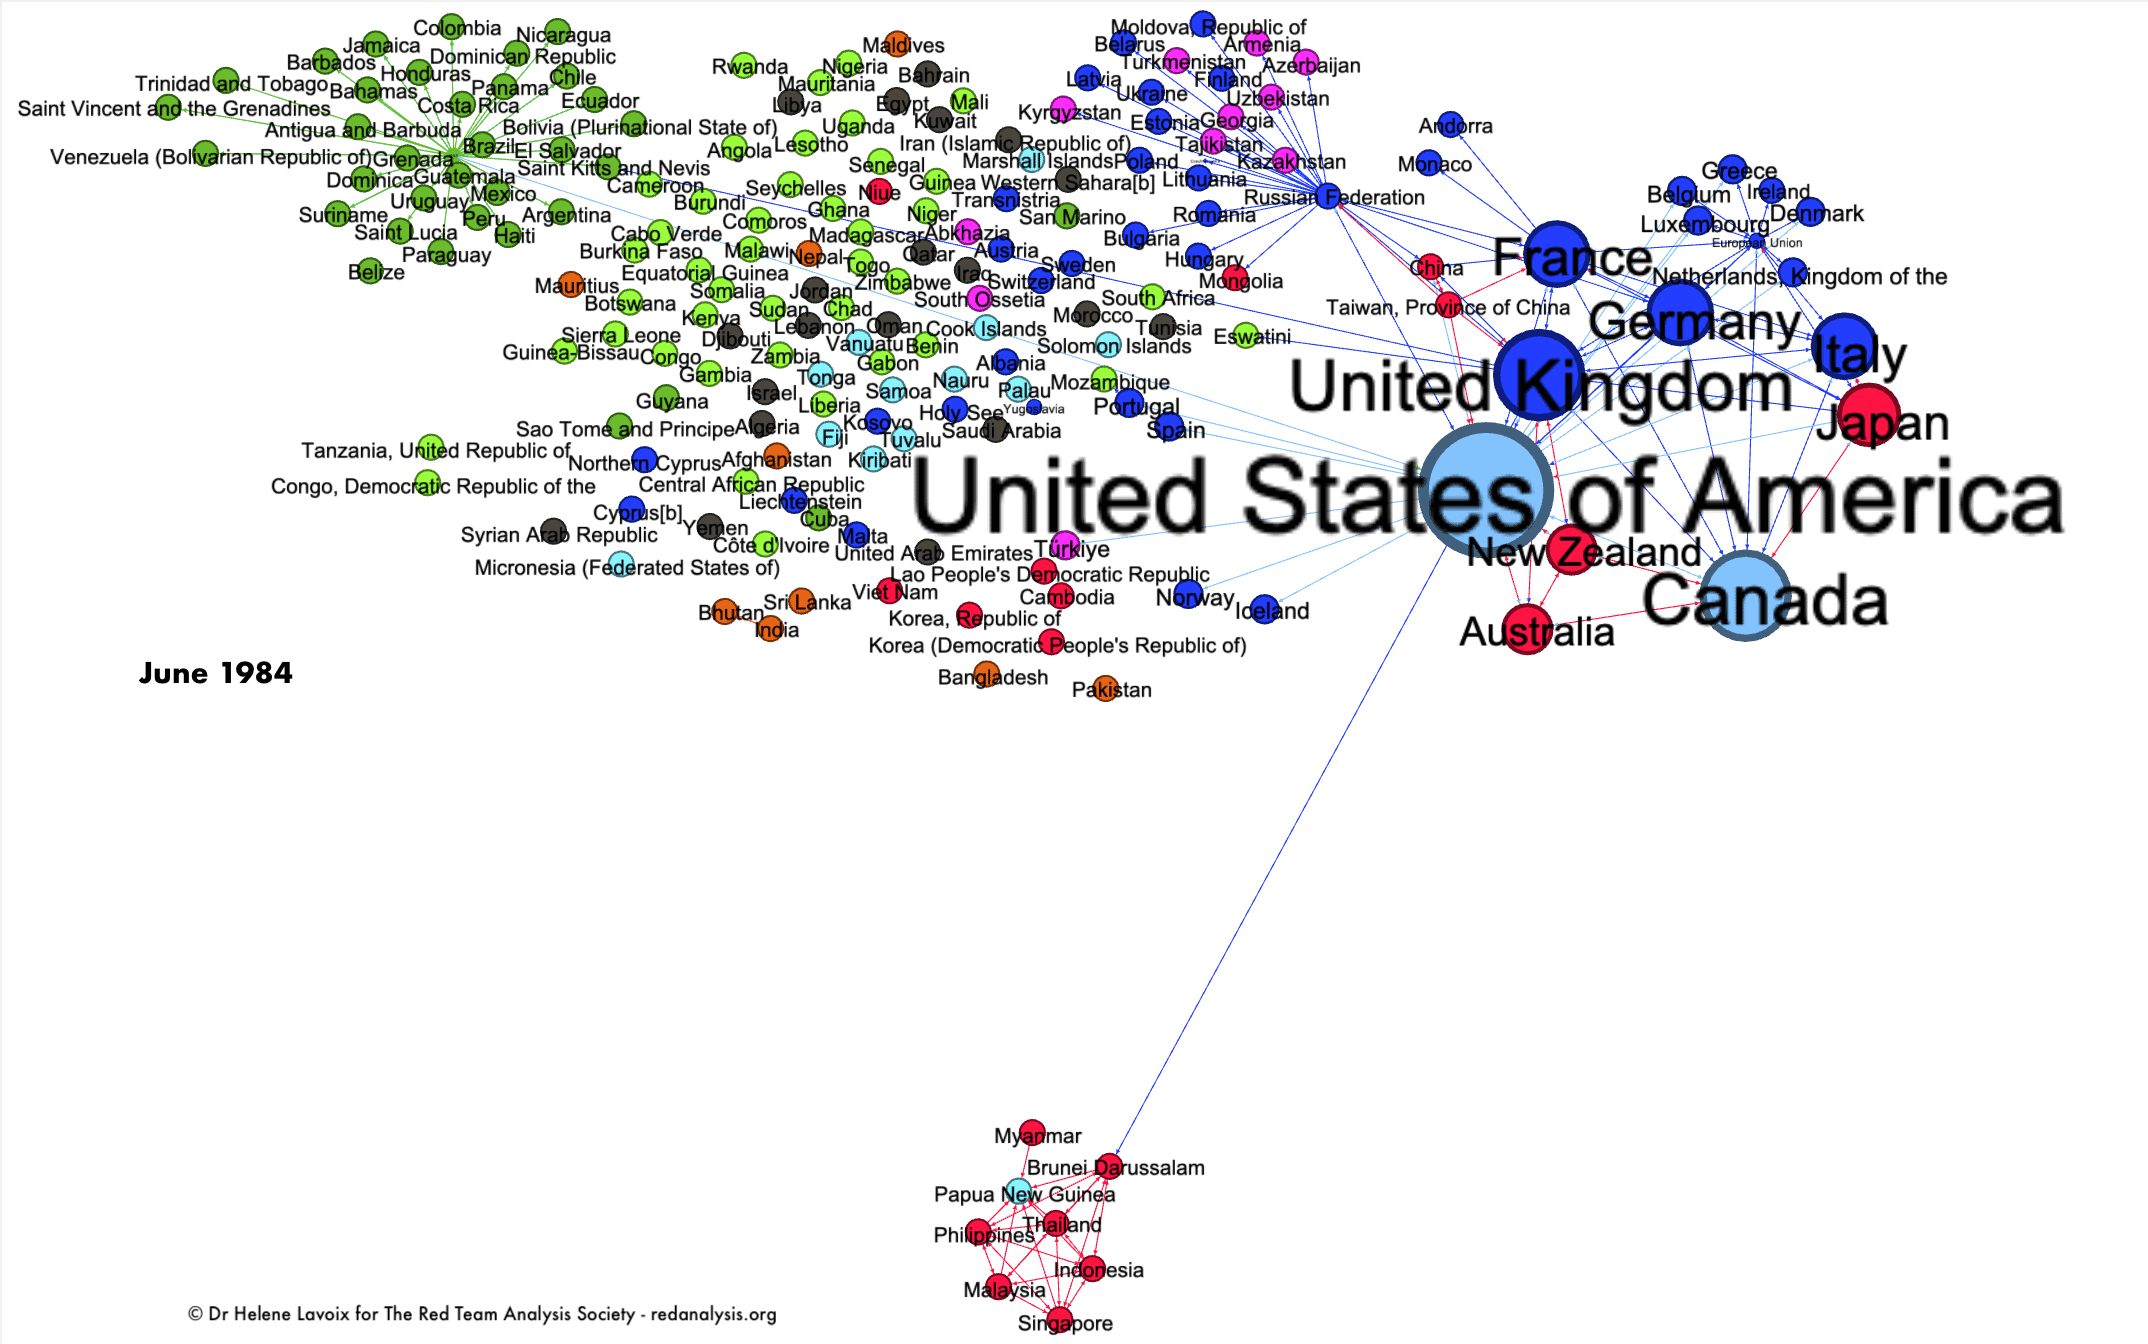
Imagine how the maps below could look like with the increase in nuclear capacity already planned we saw, to which would be added what is necessary to fill the gap to meet the trebling objectives.
Now, imagine how the maps could look like if SMR and AMR are widely added, including by commercial and industrial actors, as reportedly envisioned, for example in the U.S. by Microsoft and OpenAi to power a supercomputer for Artificial Intelligence development, or in France by Cristal Union, a cooperative group, producer of sugar and alcohol (Sebastian Moss, “Microsoft & OpenAI consider $100bn, 5GW ‘Stargate’ AI data center – report“, Data Center Dynamics, 29 March 2024 ;”Le sucrier Cristal Union installera-t-il un miniréacteur nucléaire Jimmy à Bazancourt ?“, L’Usine Nouvelle, 9 April 2024).
We should also take into account that the very size and technology of SMR should allow to locate them underground or underwater (World Nuclear Association, “Small Nuclear Power Reactors“, February 2024). In that case, the way to attack or protect those underground or underwater facilities, alongside related types of potential damages, will have to be considered. For example, although the WNA highlights that underwater facilities are safer from “man-made … hazards” (ibid.), divers teams or submersibles may also conduct attacking operations. The sabotage of the Nord Stream pipeline should serve as a lesson (e.g. UN Briefings, SC/15351, “Briefers Urge Security Council to Independently Investigate 2022 Nord Stream Pipeline Incident…“, 11 July 2023). The deleterious and wide-ranging impacts of such attacks would also need to be taken into account.
Design and deployment criteria for SMRs, with their various security stakes, will certainly be included in state’s defensive and attacking doctrines.
In terms of both defense and attack, according to the aims of the attacker, the evolution towards more nuclear plants will demand careful planning. Scenarios, using red teaming notably – i.e. understanding the enemy’s ideologies and beliefs, aims, resources, strategy etc. – will imperatively need to be crafted, to ensure security.
Estimated uranium requirements per country
Now we have a base case scenario for the future nuclear energy capacities per country, what does that imply in terms of demand for uranium?
A country’s demand for reactor-related uranium for a year is, as seen, first determined by the number of operating nuclear plants for that country. It is called “uranium requirements” and is measured in tonnes of uranium per year: tU/y (NEA/IAEA, Red Book 2022, p. 111).
However, uranium requirements are also sensitive mainly to four factors depending on the type of generator and the way it is operated: fuel cycle length or lifetime fuel cycle, uranium enrichment level and strategies of optimisation (level of tails assays chosen in the enrichment phase), discharge burn-up and capacity (or load) factors (NEA/IAEA, Red Book 2022, pp. 111-112).
As a result, the statistics given for uranium requirements are about purchase or acquisition of uranium and not consumption, which is adjusted by operators according to needs and context (Ibid.).
Here again, we shall create a base case scenario. This will allow for further detailed scenarios considering these factors and operators adjustments. We rely first on the assessments and hypotheses made by the NEA/IAEA in the Red Book 2022, i.e. “160 tU/GWe/yr, under the new assumption of a tails assay of 0.25% over the lifetime of the reactor”, knowing that, before the Fukushima accident, the Red Book used 175 tU/GWe/yr, with a tails assay of 0.30% (pp. 111-112, table p.100). Then we use the WNA latest data (published April 2024).
For the base case scenario, we use the NEA/IAEA and WNA assumptions for future nuclear reactors. Variations considering technological evolution should then be added to the base case scenario.
Glossary
Load Factor: “also called Capacity Factor, for a given period, is the ratio of the energy which the power reactor unit has produced over that period divided by the energy it would have produced at its reference power capacity over that period” (IAEA/Power Reactor Information System’s Glossary).
Lifecycle of nuclear fuel: It depends on the type of reactor. “In a pressurized
water reactor, it lasts about three to seven years,
depending on the fuel and its location in the reactor
core”. See, for example, IAEA “Lifecycle of Nuclear Fuel” (pdf).
The discharge burn-up of nuclear fuel is usually defined as the thermal energy output during the lifetime
of the fuel divided by the initial mass of heavy metal (denoted HMi). (See p. 14, NEA, “Very High Burn-ups in Light Water Reactors“, 2019).
First we should note that each country displays different “efficiency” in terms of GWe produced per tU, which also changes according to years and source of data, as shown on the chart below.
The world average for this “efficiency” seems however to remain almost constant (0,0064 for 2022 WNA data; 0,0063 for 2020/21 Red Book 2022 data). For want of another more reliable way, we use the latest “efficiency” (2022 WNA) also for the future. This “efficiency” will vary, notably considering technological evolution and types of reactors and should also lead to construct further scenarios. For those countries without nuclear energy in 2022, we use the world average efficiency, i.e. 0,0064.*
The results obtained for the base case scenario are rough estimates of future uranium requirements per country. They are indications of future trends, which will then change according to the various efforts made by each country to fill the gap to the trebling objective by 2050.
As we did for the estimated nuclear energy capacity, the next charts show the estimated yearly uranium requirements per country up until 2030, until 2039 and then after 2040 with uncertain timeline.


By 2030, China will have been catching up with the U.S. as largest purchaser of uranium. Global demand will have increased but without fundamentally altering the ranking of the largest purchasers.
However, by 2039, China will have overtaken the U.S. by far, to say nothing of other countries. It will absorb 31% of the total world uranium requirements.
Considering the long timeframes necessary to bring about new production of uranium, as seen in the previous article, it is necessary that suppliers as well as other “consumer” countries start considering the large increase of China’s requirements and include it in their strategies.
After 2040, China’s uranium requirements will dwarf other countries’ including those of the U.S.. They could represent 3,7 times those of America. China could absorb 44% of the world uranium requirements. Furthermore, the order of uranium purchasers changes. China and the U.S. are followed by Russia then India. France is only at the 5th position, when it was third, just after the U.S., previously.
Whatever its ranking in terms of uranium requirements, for a country, being able to acquire uranium will be fundamental. Indeed not only the costs to build nuclear plants are heavy, but also such investments mean dependency on electricity and nuclear-generated power grows. Thus, the strong increase in China’s requirements, if not planned also with others in mind, could give rise to bitter competition for uranium.
All actors will need to take those trends into account.
Considering this context, what is the outlook for the supply of uranium? This is what we shall see with the next article.
Notes
*For the 2020 and 2021 data of the NEA/IAEA “Red Book”, note that some fleet of nuclear reactors use mixed oxide (MOX) fuel while others don’t. MOX fuel is constituted by plutonium, from reprocessed nuclear fuel or from weapons-grade plutonium, mixed with either natural uranium, reprocessed uranium or depleted uranium. At the start of 2021, the countries using MOX fuel are France (23 reactors), India (one reactor), and the Netherlands (one reactor) (NEA/IAEA, Red Book 2022, pp.123-124).
As MOX fuel is not counted as uranium requirement in the NEA/IAEA statistics, we may assume that the high efficiency of energy production per tU shown by France compared with other countries in the Red Book 2022 stems from the use of MOX fuel (Ibid & p.100).
The statistics of the WNA (April 2024) specify that uranium requirements are for 2024 (title of the column), but give as source: “World Nuclear Association, The Nuclear Fuel Report (published September 2023, reference scenario forecast) – for uranium requirements”, which would imply that the uranium requirements given are for 2022.